Roysambu, Kasarani
Call: +254 723 786161 / +254 735 981098 | ISO 9001:2015


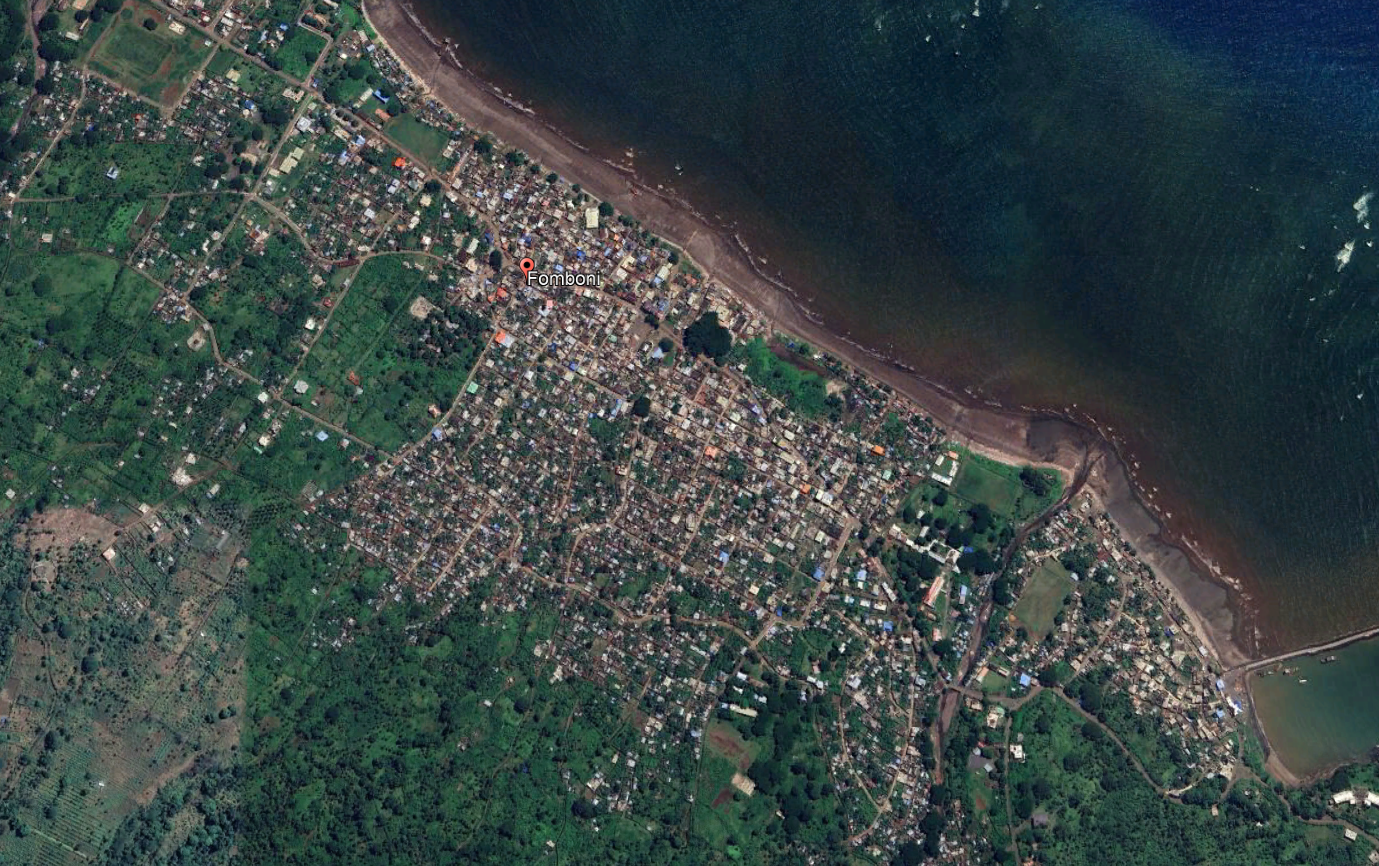
Fomboni’s coast is a blend of sandy beaches, fringing reefs, and low-lying settlements. Many homes, shops, and public spaces sit only meters from the water, leaving them vulnerable to erosion. Schools and markets near the shoreline have reported periodic flooding during high tides.
The DE Africa Coastlines Service: A Game-Changer for Island Monitoring
Digital Earth Africa provides free, continent-wide satellite analytics to help African countries monitor environmental change. The Coastlines product uses decades of satellite data, particularly from the Landsat and Sentinel missions to map the position of the shoreline each year.
For a remote island like Comoros, where collecting field data is costly and time-consuming, the service offers three major advantages:
1. Long-term shoreline history
DE Africa provides annual coastline positions dating back to the year 2000, making it possible to identify erosion or accretion trends over two decades.
2. Consistent, science-ready imagery
The platform automatically corrects satellite imagery for clouds, tides, and atmospheric distortions, ensuring measurements are reliable.
3. Easy access for non-technical users
Maps and downloadable data can be accessed through the DE Africa Map portal or as a dataset via Google Earth Engine, without the need for advanced programming skills.
Methodology for Monitoring Coastal Change in Fomboni
The following workflow was used in analyzing erosion in Fomboni using DE Africa’s Coastlines service.
1. Identifying the Area of Interest: This began by selecting Fomboni’s coastline often divided into segments (port area, east beaches, southern mangroves, etc.). This segmentation helped to isolate the erosion hotspots.
2. Accessing DE Africa Coastline Data: The coastline dataset is accessed via the DE Africa Maps platform, where yearly shoreline layers can be viewed directly.
3. Extracting Shoreline Positions: The dataset provides an annual shoreline polyline based on satellite observations. For Fomboni, these can show subtle yearly shifts or dramatic changes after major weather events.
4. Calculating Erosion or Accretion Rates: Using GIS tools (like QGIS or ArcGIS), we were able to measure: Distance between shoreline positions from different years, Direction of change (land retreat or land gain) and the rates, expressed in meters per year, for example, a beach retreat of 12 m over 10 years indicates –1.2 m/year erosion.
6. Visualizing Results for Decision-Making: Shoreline changes were presented through erosion hotspot heatmaps and Cross-section analyses. This allows planners, NGOs, and community leaders to make informed decisions.

Findings Observed Around Fomboni
While the exact statistics depend on the specific analysis, typical patterns observed through satellite monitoring include:
• Steady shoreline retreat on the southeastern beaches, likely linked to reduced sediment supply and wave exposure
. • Stabilized or accreting areas near mangrove patches, highlighting the protective role of coastal vegetation. • Localized erosion near the port, where infrastructure alters natural sand movement.
The Future of Coastal Monitoring in Comoros as climate pressures increase, the need for continuous monitoring becomes even more critical. Tools like DE Africa’s Coastlines service empower small island nations by making satellite analytics accessible to all-scientists, students, local governments, and community groups.
