Monitoring land cover change over time is essential to understanding ecosystem health, biodiversity, forest carbon cycling, and much more. Land cover/land use (LCLU) data and maps are critical components for climate monitoring applications such as Greenhouse Gas (GHG) emissions reports. LCLU changes, due primarily to deforestation,
contribute about 20% of natural GHG emissions. In Africa, changes in land cover are in fact the biggest contributor, so it is especially important to track these changes there.
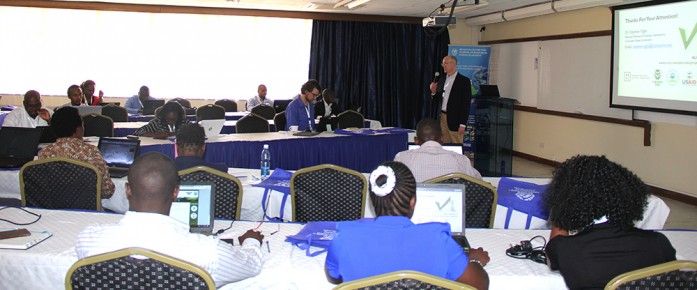
During the past few years, RCMRD/SERVIR E&SA has been supporting several African countries in GHG emissions inventory by generating Landsat-derived land cover maps in close consultation with end-users in forest departments and environmental ministries. The maps constitute the results needed for the countries’ submittals of National Communications to the UN Framework Convention on Climate Change (UNFCCC) project to quantify the GHG inventory. To support and enhance this work, a workshop on the “Use of Agriculture Land Use tool for Greenhouse Gases (GHG) Inventory Compilation” was held in Kasarani (Nairobi) by RCMRD from 13-16 March 2017.
Led by Dr. Stephen Ogle and Matt Ramlow from Colorado State University (CSU), the workshop’s main objective was to continue to build the capacity of the SERVIR-E&SA Hub/RCMRD and the region in GHG inventory compilation using Agriculture Land Use (ALU) with a focus on the Agriculture, Forestry and Other Land Use (AFOLU) sector. This workshop is one of a series of trainings to be supported by the hub.
Phoebe Oduor, the hub’s thematic lead for LCLU and GHG inventories, commented that, as a result of the training, “Participants will have a basic understanding of how national emissions are calculated. The aim is to have countries use this to inform National Communications or different project implementation levels and to inform policy decisions.”
She added that RCMRD/SERVIR-E&SA, in collaboration with the team from CSU, will first be working towards full implementation in Uganda. Subsequently, the RCMRD/SERVIR-E&SA team will cascade this effort to other countries in the region.
“Consistent maps of land-use/land-cover change are critical input data in informing the AFOLU sector,” said Oduor. “SERVIR’s previously developed land cover maps have been used in the Second National Communications to the United Nations Framework Convention on Climate Change (UNFCCC) in Rwanda, Lesotho, and Malawi, among other countries. These capacity building workshops will strengthen RCMRD/SERVIR-Eastern and Southern Africa’s work with the countries in compilations of national GHGs.”
ALU GHG inventory software presented during the March workshop simplifies the process of inventory compilation through stepwise procedures that allow calculations of emissions of three GHGs (nitrous oxide, methane, and carbon dioxide) as well as consideration of all sources of AFOLU emissions. It supports both tier one and tier two reporting* and documentation of all data sources. The software’s other strengths include rigorous quality control measures as well as analysis of uncertainty.
After the workshop, PhD candidate and development worker Nancy Rapando said “I will disseminate it to my peers at the University of Nairobi as well as use the knowledge gained from this workshop on use of agriculture land use tool for GHG inventory compilation. My work as an agriculturalist working at Act Change Transform (Act!) demands that we do assessments on GHG to establish the food-related emissions and the impacts of climate change on agriculture and the food system.”
From Turkana County in Kenya, Mr. Chris Aletia Imana, the new County Executive Committee member (CEC) in the Ministry Water and Irrigation, noted that the workshop was very timely as Kenya and especially for Turkana County, which is undergoing a food shortage and drought crisis as a result of climate change.
“Moderate warming and more carbon dioxide in the atmosphere may help some plants to grow faster,” says Imana. “However, more severe warming, floods, and drought may reduce yields. Livestock may be at risk, both directly from heat stress and indirectly from reduced quality of their food supply. I will work with the ministries of agriculture both at the county and national levels to use this ALU tool to better assess GHG emission estimates.”
While appreciating the workshop and lauding the organizers and facilitators, Veronica Ndetu from the Ministry of Agriculture, Livestock and Fisheries’ Climate Change & Climate Smart Agriculture Unit recommended that USAID, NASA, and RCMRD/SERVIR-E&SA increase the duration of the training, conduct sector specific trainings, and demonstrate how data is collected, validated, and compiled in the ALU tool.
She noted that, at this point, she is not able to transfer the knowledge to colleagues and stakeholders as the facilitators used data that already existed. However, she added that once the data gathering process is demonstrated to her, she “will be able to disseminate the training to colleagues and potential stakeholders.”
“The compilation process requires a lengthy series of tasks, such as collecting emissions factors and activity data, selecting appropriate methods, estimating GHG emissions and removals, implementing uncertainty assessment and quality assurance/quality control procedures,” said Caroline Muriithi, an RCMRD/SERVIR-E&SA staff member, who also attended the workshop.
She added, “I am part of this project, and we have developed land-use/land-cover change maps for nine countries. I expect to see how these products will be used in the ALU tool to support of GHG inventories in the region.”
See photos here
(Content for this article provided by Dorah Nesoba, Communications and Outreach Expert at RCMRD/SERVIR-Eastern & Southern Africa.)
Notes:
The four-day training covered GHG reporting overview; IPCC reporting guidelines, developing a GHG inventory management system; land representation; activity data; key category analysis, quality control and quality assurance, and uncertainty analysis as well as compilation emissions from fertilizers, livestock and different land uses (forestry, cropland and grassland) using data for Kenya.
*Tier 1 is the basic method, frequently using IPCC-recommended country-level defaults, while Tiers 2 and 3 are each more demanding in terms of complexity and data requirements.


